Administrator

Home/Administrator

About Administrator

This author has not yet filled in any details.
So far Administrator has created 175 blog entries.

The U.S. Is Producing a Record Amount of Milk and Dumping the Leftovers

There’s so much milk flowing out of U.S. cows these days that some is ending up in dirt pits because dairies can’t find buyers.

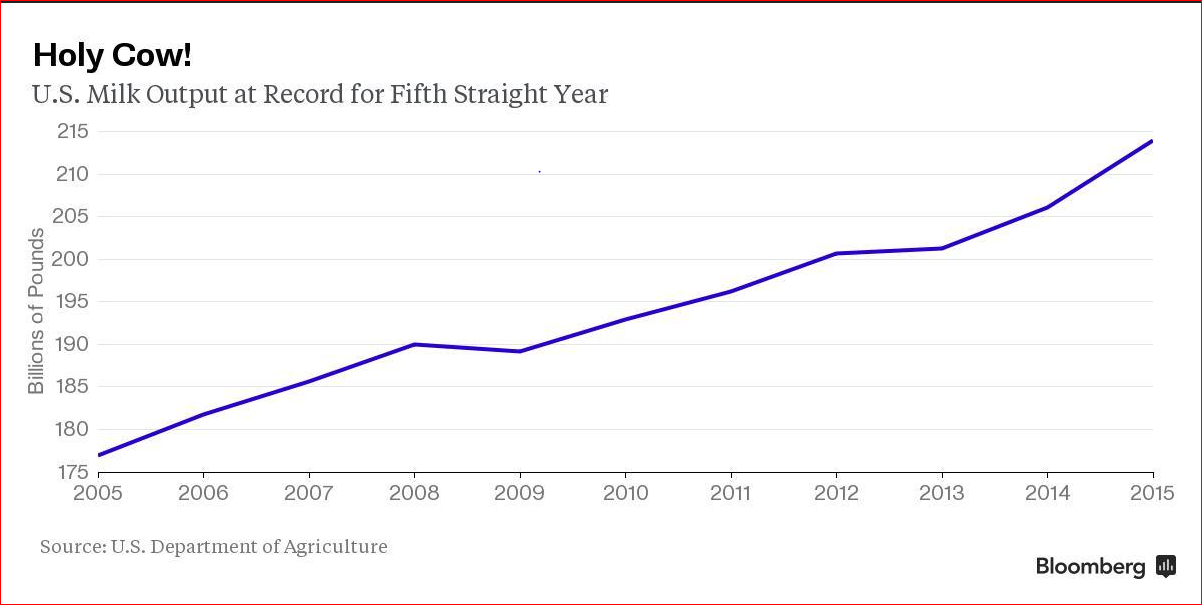
Domestic output is set to be the highest ever for a fifth straight year. Farmers are still making money as prices tumble because of cheaper and more abundant feed for their herds. Supplies of raw milk are topping capacity at processing plants in parts of the U.S. and compounding a global surplus even with demand improving.

A River of White

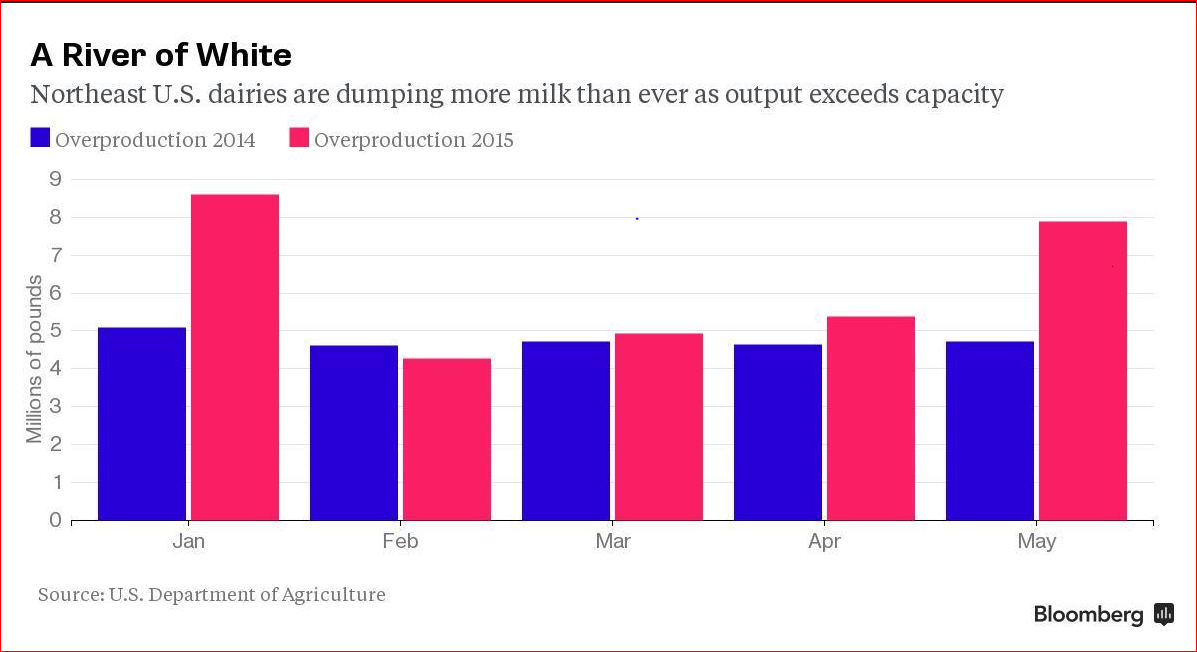
Agri-Mark, a 1,200-dairy cooperative in New England that had $1.1 billion of sales last year, started pouring skim milk last month into holes used for livestock manure. It was the first time in five decades, and farmers so far have unloaded 12 truckloads, or 600,000 pounds (272 metric tons). While having small amounts of milk spoil or go unsold isn’t unusual, Northeast dairies dumped 31 percent more this year through May than the same period of 2014, government data show.

“Usually we’d find someone to buy it at a reduced price, or ship it to the Midwest,” said Bob Wellington, a senior vice president at Andover, Massachusetts-based Agri-Mark, which was founded in 1913. “But those plants are full. There’s no way to process it in the time needed for a perishable product.”

Global Glut

Domestic output in May reached 18.4 billion pounds, the most in any month, and is on pace to reach a record 208.7 billion pounds this year, the U.S. Department of Agriculture said June 18. Globally, production will rise 2.1 percent to a record 582.52 million tons as top exporter New Zealand sells the most ever and the European Union ends limits on dairies that had been in place since 1984, the USDA said.

U.S. farmers expanded after futures on the Chicago Mercantile Exchange surged to a record in September, fueled partly by rising cheese demand and a jump in purchases by China. Since then, warmer weather has brought a seasonal increase in supply, demand slowed from importers, and a stronger dollar eroded exports.

Holy Cow!

“The world needs less milk,” said Eric Meyer, president of HighGround Dairy, a Chicago-based broker.

Price Slump

Global dairy prices have dropped 39 percent from an all-time high in February 2014 and are the lowest in five years, United Nations data show. In Chicago, benchmark Class III milk futures, used in cheese making, are down 36 percent to $16.11 per 100 pounds from a record $25.30 in September. Prices may fall to $14.41 by the end of the year before recovering in 2016, said Tom Bailey, a New York-based analyst at Rabobank International.

New Zealand’s dollar has tumbled to a five-year low as falling milk prices amplified speculation the nation’s central bank will cut interest rates this month. The kiwi slid against almost all of its 16 major peers this year.

The milk slump has been a boon to buyers including processor Dean Foods Co. and retailer Supervalu Inc., contributing […]

By |2015-07-07T07:59:01-05:00July 7th, 2015|Commodities|0 Comments

Comparing Corn Production Expenses VS. Other Types of Farming

Lately, the USDA and its subsequent agencies have been putting out some nice data on the cost-of-production-side of farming. The most recent chart shows the variation in the percent of total expenses across different types of farms. I know that’s a mouthful, but the chart reflects how specialized US agriculture has become. While wide differences generally exist between crop and livestock farms, this new breakdown compares expenses within the major farm types. Livestock purchases are the largest component of total expenses for beef cattle farms, primarily because of the relatively high cost of feeder steers. In comparison, because of the lower cost of their animal purchases, feed expenses are the largest component of total expenses for other animal farms (primarily hog, poultry, and dairy). Specialty crop farms have a higher share of labor expenses than field crop farms, because they occupy fewer acres and are less mechanized. Other findings are fairly straightforward. For example, specialty crop farms have a higher share of labor expenses than field crop farms, because they occupy fewer acres and are less mechanized. In contrast, field crop farms, especially corn farms, spend a greater share directly on the crop including fertilizer, seeds and chemicals and rents. Interestingly, fuel expenses are relatively consistent, varying between 3% of total expenses for other animal farms to 8% for other field crop farms. This information comes the Agricultural Resource Management Survey (ARMS) which collects data at the field-level on production practices and costs (fertilizer, pesticide, labor, tillage, seed, etc.) for target commodities. The survey collects information from 48 States and is designed to be representative of the continental US and to support State-level estimates for 15 key agricultural States.Production Expenses on Farm

By |2015-07-02T07:41:50-05:00July 2nd, 2015|Articles|0 Comments

Boom in US ethanol output, and demand, ‘isn’t over yet’

By Agrimoney.com – Published 24/06/2015

US ethanol production, which set a record last week, is poised for fresh all-time highs, as strong demand and the prospect of a “mini harvest” of corn support margins, broker Linn Group said.

An official report on Wednesday showed US ethanol production gaining 14,000 barrels a day last week to hit 994,000 barrels a day, the highest on data going back to 2010.

The rise in output came despite margins which have been pressed by the recovery in corn prices, with Chicago futures rebounding more than 5% from contract lows set in mid-June.

“We have seen production margins come down to breakeven in some areas on the fringes of the western Corn Belt,” said Jerrod Kitt at Chicago-based broker Linn Group.

Even in core areas of the eastern Corn Belt, with ready markets for the distillers’ grains feed ingredient made as a byproduct of ethanol manufacture, margins are about 10 cents a gallon, “give or take 5 cents”, he said.

‘Mini harvest’

However, Mr Kitt forecast that the rise in production was sustainable, in part thanks to the prospect of ready supplies of corn ahead, as farmers sell stocks left over from last year’s record harvest.

Mr Kitt said that “a lot of producers are sitting on a lot of corn,” with many growers holding out for higher prices, a strategy which has proved successful in many recent years.

A key US Department of Agriculture report next week is expected to show overall US corn inventories at 4.56bn bushels as of the start of this month, a rise of 18.5% year on year.

The boost to supplies as growers bring crop to market, to clear storage space for the next crop, will be akin to a “mini harvest”, with the potential for pressure on prices.

Inventories tumble

Meanwhile, demand is proving unexpectedly strong.

“The surprise about the latest ethanol data was not the rise in production but the drop in stocks,” Mr Kitt told Agrimoney.com, noting that inventories tumbled by 878,000 barrels last week to a five-month low of 19.84m barrels.

That is an unusually strong pace of decline and, coming against a backdrop of elevated production too, indicates robust demand for ethanol, which appears to be coming in part from strong exports.

“Canada is our number one export market, but others are pretty active too,” with ideas of strong shipments to the likes of North Africa and the Middle East too.

Booming market

And demand looks like remaining strong for now, with the US driving season ahead too.

“We are going to move between weeks of record production and record consumption,” Mr Kitt said.

“It is definitely going to be an exciting market, if you catch it right.”

By |2015-06-26T08:24:26-05:00June 26th, 2015|Commodities|0 Comments

Who Likes Us And Who Doesn’t?

America’s overall image around the world remains largely positive. Across the nations surveyed (excluding the U.S.). A median of 69% hold a favorable opinion of the U.S., while just 24% express an unfavorable view. However, there is significant variation among regions and countries. Below are some of the specifics. To read more details and specifics please go to Pew Research.
US Opinion

By |2015-06-25T10:29:27-05:00June 25th, 2015|Uncategorized|0 Comments
Go to Top