Commodities

Home/Commodities

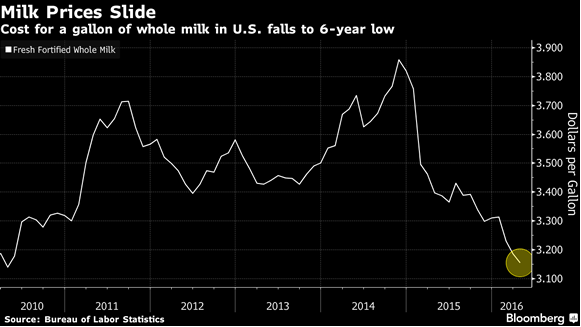
Yes, We Definitely Got Milk

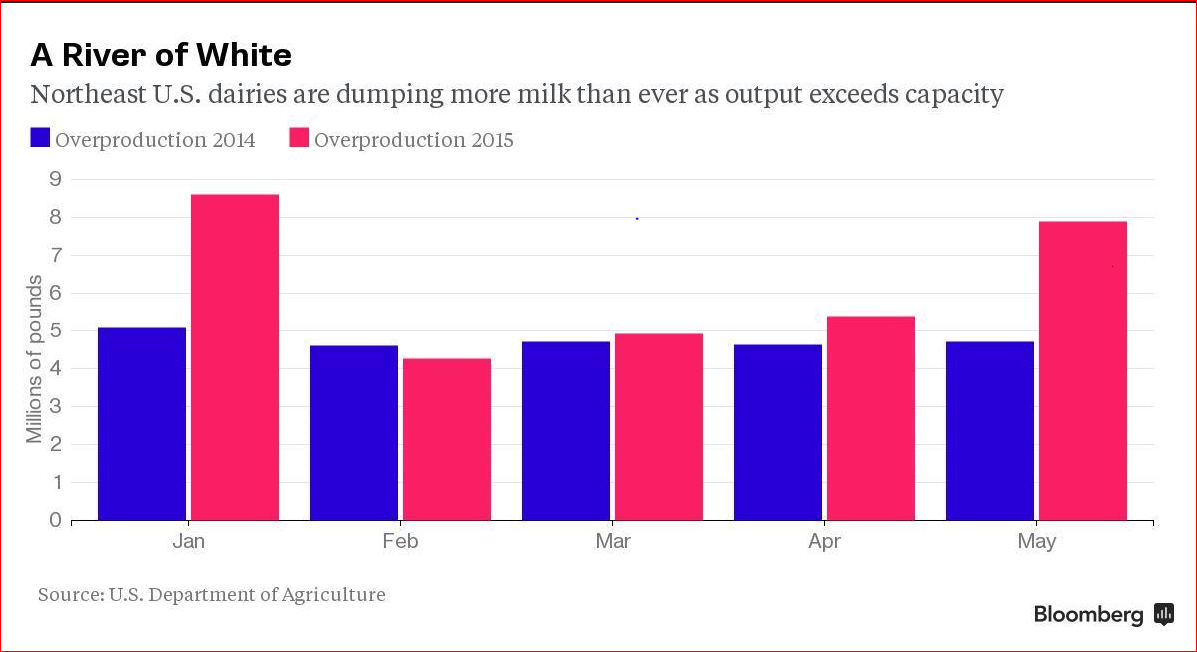
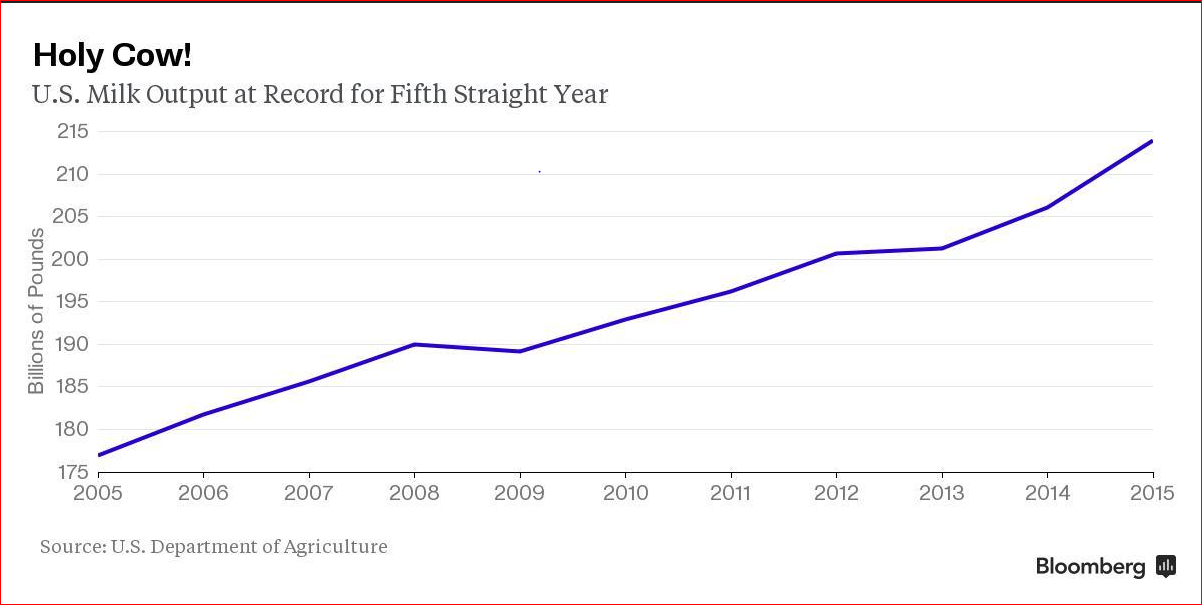
U.S. dairy cows have been busy pumping so much milk that 2016 output is expected to reach a record, according to the Department of Agriculture. Inventories are becoming burdensome at processing plants in some regions, and sellers are “struggling to find a home” for supplies, the agency said. Consumers are benefiting: they’re paying the lowest prices for retail milk in six years, government data showed Tuesday.

Milk Price Slide

By |2016-05-18T07:47:54-05:00May 18th, 2016|Commodities|0 Comments

Morning Summary:

Stock markets around the globe are mixed with very little in the way of new headlines. Yesterday’s GDP data for the U.S. showed the nation’s economy expanded at a 2.3% annualized rate in the second quarter, which was a touch below most analyst expectations. Commodities again feel under pressure as gold looks poised to retest multi-year lows on reports of “China’s H1 gold consumption plunging 19% on year”. Oil is also under pressure on morning headlines about record exports from China, Iran and Iraq. Here at home today the EIA releases its monthly Petroleum Supply report, which covers May activity. U.S. crude production hit a 44-year high in April of 9.7 million barrels per day. In their last update, they forecasted U.S. production would drop by 50,000 barrels per day in May and continue tapering off in the last half of the year. Obviously the trade will be anxious to see signs of this actually occurring. Remember, U.S. crude inventories are now estimated to be some 35% or 125 million barrels (plus) above the long-term 30-year average for this time of year. We also get the latest Baker Hughes rig count data this afternoon, along with energy companies like Exxon, Phillips 66, and Chevron reporting earnings. Also out today is the second-quarter Employment Cost Index, a closely watched indicator of potential inflation. Consensus is for an increase of +0.6%. Obviously, a big gain here would increase expectations for the Fed to raise rates in September or December. Looking to next week, investors are very anxious to see the July Employment Report which is due out next Friday. This is the first of just two monthly employment reports before the Fed’s next meeting in September. Other economic data next week includes: Personal Income and Outlays, PMI Manufacturing and Construction Spending on Monday; Factory Orders Tuesday; International Trade Wednesday. It will also be another busy week for earnings. Most of the major bellwethers have already weighed in but there are a lot of energy and biotech results still ahead. Also be aware that China weighs in over the weekend with Manufacturing data, which comes ahead of key trade data next Friday.

By |2015-07-31T14:36:10-05:00July 31st, 2015|Articles, Commodities|0 Comments

These 10 States Will Be Hurting the Most After the Commodities Meltdown

In the brutal commodities meltdown, all U.S. states are not created equal.

In fact, the impact has been vastly different. The Bloomberg Commodity Index last week reached a 13-year low and has plunged 61 percent since its peak in 2008. That matters a lot in, say, Wyoming, Louisiana, Texas and Nebraska. Not so much in New Jersey or Massachusetts, for example. The map below shows the top 10 states with the greatest exposure as measured by mining and agriculture’s share of the economy in 2014. The darker the color, the more the state’s economy is at risk.

Where it hurts the most

Wyoming is home to most of the top producing coal mines in the U.S. Its mining and agriculture industries generated 36 percent of its economic output in 2014, more than any other state, according to Moody’s Analytics’s calculations using Commerce Department data.

It's Been a Brutal Year


The top nine states on the map got  at least 10 percent of their gross state product from energy, mining and agriculture last year: Wyoming, Alaska, North Dakota, West Virginia, Oklahoma, Texas, New Mexico, Louisiana and South Dakota. Another six got more than 7 percent, compared to just 3.9 percent for the U.S. as a whole.

New Jersey, Massachusetts, New York, Rhode Island and Connecticut have almost none of their economies in those industries, just 0.3 percent or less.

A year ago, Federal Reserve policy makers and many private economists viewed falling oil prices as an economic boom that would boost consumer confidence and spending. While there’s been some evidence of that in restaurant sales for example, it’s been partly offset by the slowdown in mining and farming that has reduced employment in a checkerboard of states.

The commodities collapse has cut monthly employment gains in the U.S. by around 50,000 a month this year, estimates Mark Zandi, Moody’s chief economist in West Chester, Pennsylvania.

“Growth has slowed sharply in the commodities-producing parts of the country, most significantly in the energy sector,” Zandi said. “The very heady rates of growth of recent years have given way to pedestrian growth and in some places no growth at all.”

Farming has seen a less significant loss of jobs, but “we will see much weaker income numbers in agriculture-producing regions,” he said.

That’s also reduced wage growth in those states, Goldman Sachs Group Inc. economist David Mericle wrote in a report July 20.

While Federal Reserve Chair Janet Yellen has said there are tentative signs wages are picking up, “a counterpoint to this generally encouraging picture is that the shale states have seen major setbacks recently,” Mericle wrote.

Getting Drilled


In June, there were job losses in Wyoming, West Virginia, Alaska and Idaho, states that all had more than twice as much of their economies tied to farming and mining than the […]

By |2015-07-28T08:33:09-05:00July 28th, 2015|Articles, Commodities|0 Comments

• Why We Still Need Rain:

  • Studies clearly show that rescue applications during the late vegetative stages can result in increased yields and economic returns. However, it is important to remember that dry conditions after the rescue N application can limit the effectiveness of additional N because water is needed to move N into the root zone. Is It Too Late? Nitrogen applications after R1 (silking) are generally not encouraged, as some studies have shown that economic yield response to N fertilization seldom occurs after pollination. However, under severe N deficiency, some response may occur to applications of low rates of N (30 to 60 pounds) as late as three weeks afteDue to Nitrogen Dificiencyr pollination (Thomison, 2010).
By |2015-07-21T13:15:05-05:00July 21st, 2015|Articles, Commodities|0 Comments

The U.S. Is Producing a Record Amount of Milk and Dumping the Leftovers

There’s so much milk flowing out of U.S. cows these days that some is ending up in dirt pits because dairies can’t find buyers.

Domestic output is set to be the highest ever for a fifth straight year. Farmers are still making money as prices tumble because of cheaper and more abundant feed for their herds. Supplies of raw milk are topping capacity at processing plants in parts of the U.S. and compounding a global surplus even with demand improving.

A River of White

Agri-Mark, a 1,200-dairy cooperative in New England that had $1.1 billion of sales last year, started pouring skim milk last month into holes used for livestock manure. It was the first time in five decades, and farmers so far have unloaded 12 truckloads, or 600,000 pounds (272 metric tons). While having small amounts of milk spoil or go unsold isn’t unusual, Northeast dairies dumped 31 percent more this year through May than the same period of 2014, government data show.

“Usually we’d find someone to buy it at a reduced price, or ship it to the Midwest,” said Bob Wellington, a senior vice president at Andover, Massachusetts-based Agri-Mark, which was founded in 1913. “But those plants are full. There’s no way to process it in the time needed for a perishable product.”

Global Glut

Domestic output in May reached 18.4 billion pounds, the most in any month, and is on pace to reach a record 208.7 billion pounds this year, the U.S. Department of Agriculture said June 18. Globally, production will rise 2.1 percent to a record 582.52 million tons as top exporter New Zealand sells the most ever and the European Union ends limits on dairies that had been in place since 1984, the USDA said.

U.S. farmers expanded after futures on the Chicago Mercantile Exchange surged to a record in September, fueled partly by rising cheese demand and a jump in purchases by China. Since then, warmer weather has brought a seasonal increase in supply, demand slowed from importers, and a stronger dollar eroded exports.

Holy Cow!

“The world needs less milk,” said Eric Meyer, president of HighGround Dairy, a Chicago-based broker.

Price Slump

Global dairy prices have dropped 39 percent from an all-time high in February 2014 and are the lowest in five years, United Nations data show. In Chicago, benchmark Class III milk futures, used in cheese making, are down 36 percent to $16.11 per 100 pounds from a record $25.30 in September. Prices may fall to $14.41 by the end of the year before recovering in 2016, said Tom Bailey, a New York-based analyst at Rabobank International.

New Zealand’s dollar has tumbled to a five-year low as falling milk prices amplified speculation the nation’s central bank will cut interest rates this month. The kiwi slid against almost all of its 16 major peers this year.

The milk slump has been a boon to buyers including processor Dean Foods Co. and retailer Supervalu Inc., contributing […]

By |2015-07-07T07:59:01-05:00July 7th, 2015|Commodities|0 Comments
Go to Top