Monthly Archives: July 2015

Home/2015/July

U.S. ethanol makers race to expand even with policy uncertainty

Some U.S. ethanol producers are racing to bring on capacity, pushing output to fresh highs even as soaring corn prices tighten margins and the nation’s biofuels program faces prolonged uncertainty.

Betting on exports and robust domestic fuel demand, four companies are finalizing expansions and projects that will add 375 million gallons of corn-based ethanol capacity this year.

That’s the equivalent of adding some 24,000 barrels a day.

It is only a sliver of the nation’s nearly 1 million barrel per day output and small compared with expansions in recent years as companies raced to build after Washington launched the renewable fuels program in 2005.

Still, the new flows are expected to push output to fresh records at a time when inventories are near three-year highs and margins are beginning to buckle as corn prices rise.

They also come as the biofuels program faces a prolonged era of uncertainty. The Environmental Protection Agency in May unveiled long-awaited targets for biofuels use through 2016.

Attacks on the controversial policy are mounting. Oil refiners have threatened legal action to overhaul the program, and a U.S. lawmaker is considering a bid to defund the program.

Even so, Marquis Energy LLC is pushing ahead with its project to double capacity at its 150-million-gallon facility in Hennepin, Illinois, making it the largest U.S. dry-mill.

“We’ve got emerging world markets, gasoline demand is up,” said Marquis chief Mark Marquis in an interview.

The plant’s location and low costs will help it navigate tightening margins, Marquis said.

The expansion, four years in the making, will be complete in December.

NEW CAPACITY, NEW CAUTION

While consumption remains firm for now, rivals are watching the expansions with caution.

“Where’s all that ethanol going to go? I would say the market is a little bit nervous,” said Neil Koehler, co-founder and Chief Executive Officer of Pacific Ethanol Inc, which has eight plants with 515 million gallons of capacity.

Plant run-rates hit a record 994,000 barrels per day last month, partially as capacity has ramped up at facilities owned by Noble Group and by Ergon Biofuels.

Dakota Spirit AgEnergy, a $155 million project, is fine-tuning a 65-million-gallon ethanol plant, said Jeff Zueger, chief executive officer of Midwest AgEnergy Group.

Demand growth expectations – at least in the short term – are uncertain. Oil companies say that ethanol use in gasoline is capped at 10 percent of U.S. gasoline use projected to rise to 138.7 billion gallons this year.

Margins are already below 20 cents a gallon, half of the eight-year average of about 40 cents a gallon and down from records above $2 a gallon last year, according to Iowa State University.

Plants will be profitable so long as ethanol prices, now around $1.60 a gallon, stay above $1.

But once the summer driving season ends, many producers worry inventories will resume their rise, prices will fall and higher-cost producers may be forced to dial back or idle.

“Markets can be brutal. Depending on how quick and how brutal, you could have smaller players shutting down,” Koehler said. (Editing by Eric Walsh)
By |2015-07-08T10:43:52-05:00July 8th, 2015|Articles|0 Comments

The U.S. Is Producing a Record Amount of Milk and Dumping the Leftovers

There’s so much milk flowing out of U.S. cows these days that some is ending up in dirt pits because dairies can’t find buyers.

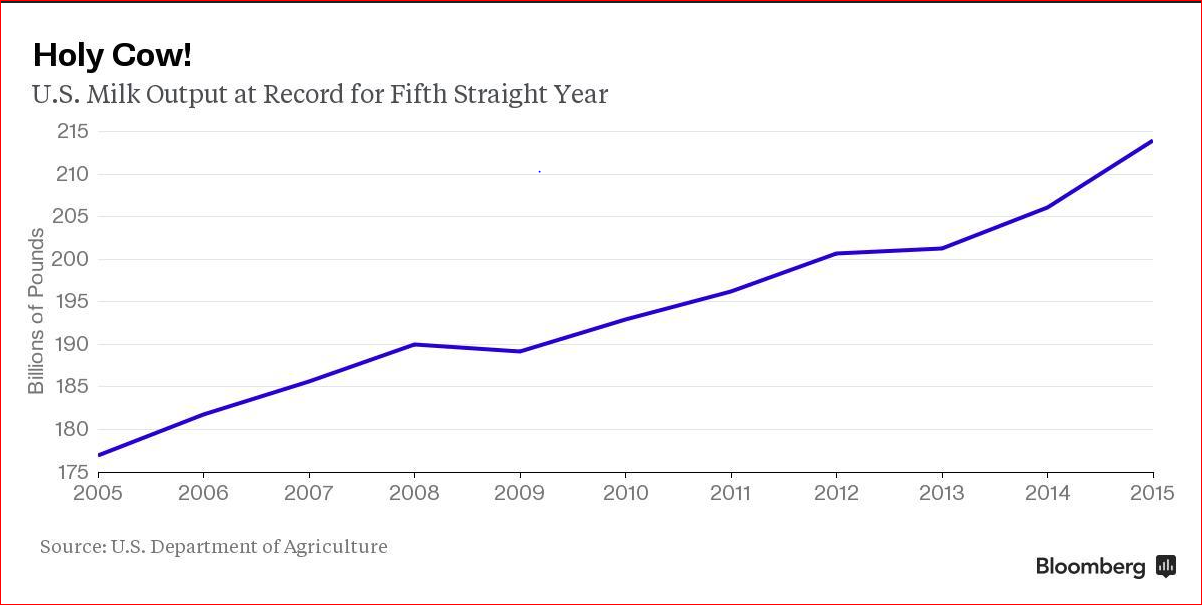
Domestic output is set to be the highest ever for a fifth straight year. Farmers are still making money as prices tumble because of cheaper and more abundant feed for their herds. Supplies of raw milk are topping capacity at processing plants in parts of the U.S. and compounding a global surplus even with demand improving.

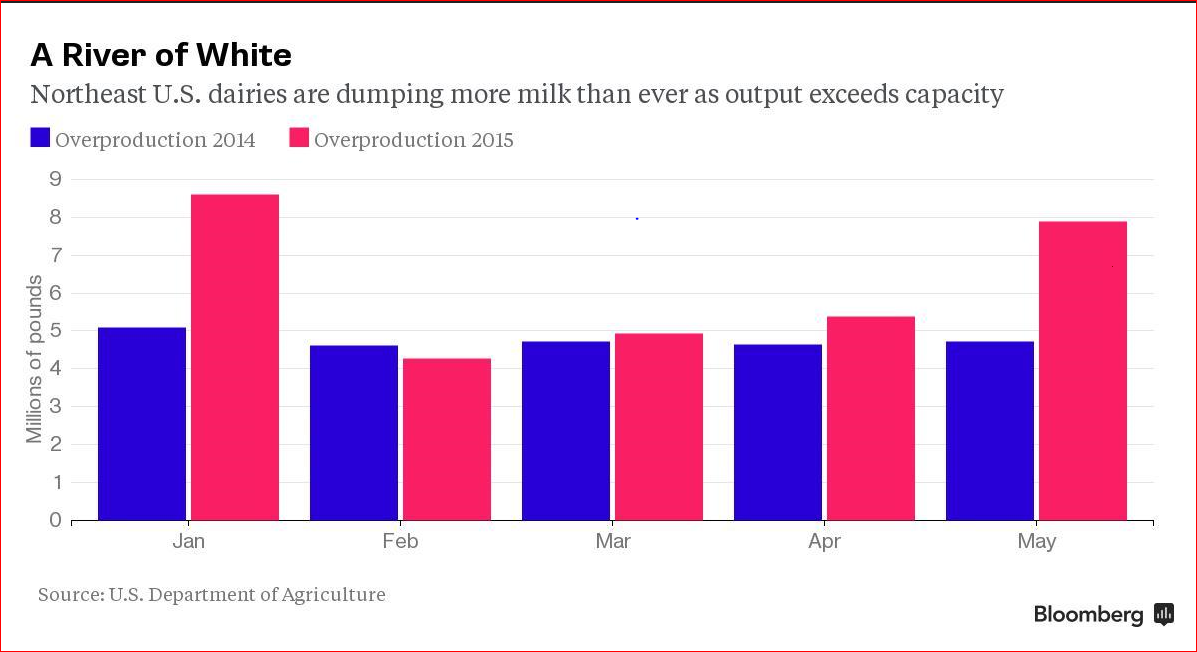
A River of White

Agri-Mark, a 1,200-dairy cooperative in New England that had $1.1 billion of sales last year, started pouring skim milk last month into holes used for livestock manure. It was the first time in five decades, and farmers so far have unloaded 12 truckloads, or 600,000 pounds (272 metric tons). While having small amounts of milk spoil or go unsold isn’t unusual, Northeast dairies dumped 31 percent more this year through May than the same period of 2014, government data show.

“Usually we’d find someone to buy it at a reduced price, or ship it to the Midwest,” said Bob Wellington, a senior vice president at Andover, Massachusetts-based Agri-Mark, which was founded in 1913. “But those plants are full. There’s no way to process it in the time needed for a perishable product.”

Global Glut

Domestic output in May reached 18.4 billion pounds, the most in any month, and is on pace to reach a record 208.7 billion pounds this year, the U.S. Department of Agriculture said June 18. Globally, production will rise 2.1 percent to a record 582.52 million tons as top exporter New Zealand sells the most ever and the European Union ends limits on dairies that had been in place since 1984, the USDA said.

U.S. farmers expanded after futures on the Chicago Mercantile Exchange surged to a record in September, fueled partly by rising cheese demand and a jump in purchases by China. Since then, warmer weather has brought a seasonal increase in supply, demand slowed from importers, and a stronger dollar eroded exports.

Holy Cow!

“The world needs less milk,” said Eric Meyer, president of HighGround Dairy, a Chicago-based broker.

Price Slump

Global dairy prices have dropped 39 percent from an all-time high in February 2014 and are the lowest in five years, United Nations data show. In Chicago, benchmark Class III milk futures, used in cheese making, are down 36 percent to $16.11 per 100 pounds from a record $25.30 in September. Prices may fall to $14.41 by the end of the year before recovering in 2016, said Tom Bailey, a New York-based analyst at Rabobank International.

New Zealand’s dollar has tumbled to a five-year low as falling milk prices amplified speculation the nation’s central bank will cut interest rates this month. The kiwi slid against almost all of its 16 major peers this year.

The milk slump has been a boon to buyers including processor Dean Foods Co. and retailer Supervalu Inc., contributing […]

By |2015-07-07T07:59:01-05:00July 7th, 2015|Commodities|0 Comments

Comparing Corn Production Expenses VS. Other Types of Farming

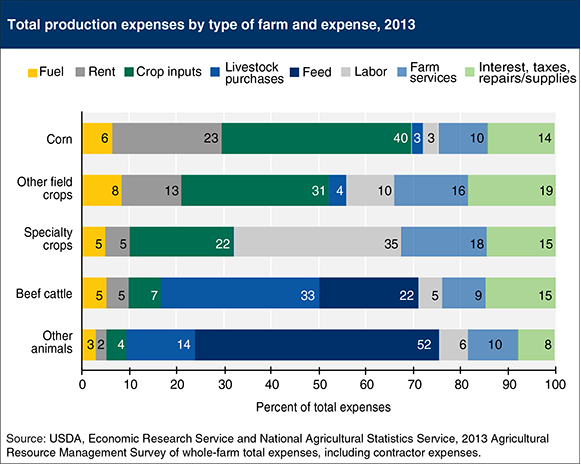
Lately, the USDA and its subsequent agencies have been putting out some nice data on the cost-of-production-side of farming. The most recent chart shows the variation in the percent of total expenses across different types of farms. I know that’s a mouthful, but the chart reflects how specialized US agriculture has become. While wide differences generally exist between crop and livestock farms, this new breakdown compares expenses within the major farm types. Livestock purchases are the largest component of total expenses for beef cattle farms, primarily because of the relatively high cost of feeder steers. In comparison, because of the lower cost of their animal purchases, feed expenses are the largest component of total expenses for other animal farms (primarily hog, poultry, and dairy). Specialty crop farms have a higher share of labor expenses than field crop farms, because they occupy fewer acres and are less mechanized. Other findings are fairly straightforward. For example, specialty crop farms have a higher share of labor expenses than field crop farms, because they occupy fewer acres and are less mechanized. In contrast, field crop farms, especially corn farms, spend a greater share directly on the crop including fertilizer, seeds and chemicals and rents. Interestingly, fuel expenses are relatively consistent, varying between 3% of total expenses for other animal farms to 8% for other field crop farms. This information comes the Agricultural Resource Management Survey (ARMS) which collects data at the field-level on production practices and costs (fertilizer, pesticide, labor, tillage, seed, etc.) for target commodities. The survey collects information from 48 States and is designed to be representative of the continental US and to support State-level estimates for 15 key agricultural States.Production Expenses on Farm

By |2015-07-02T07:41:50-05:00July 2nd, 2015|Articles|0 Comments
Go to Top