Is China Challenging To Be The World’s Breadbasket?
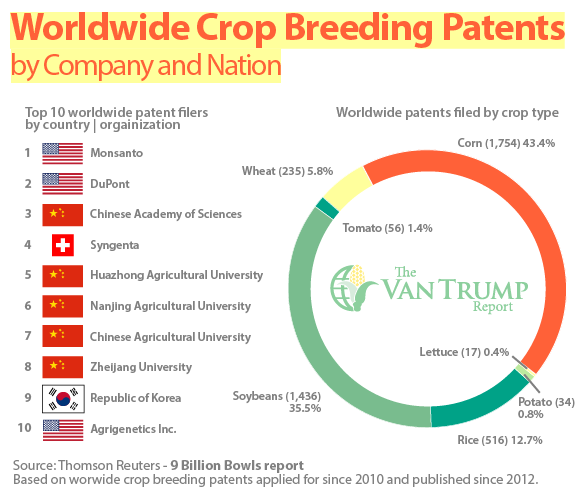
If you want to look to the future of food production, its important to look at the trends in crop breeding technology, specifically at the countries with the most patent activity. According to research from Thomson Reuters and their “9 Billion Bowls” project, a research piece I encourage everyone to read in full-detail, China is making a bold push to be the world’s breadbasket of the future, perhaps within the next decade. As it stand now the U.S. and China alone represent 68% of all the patent documents associated with crop breeding around the world. From what I understand these two countries are larger than the closet competing country by at least a factor of five. However, it’s notable that while the U.S. has more patent applications over the past 5 years than China, the majority of the U.S. documents are coming from a small collection of private companies, while the Chinese applications are coming from a larger number of academic institutions. Once China’s private industry begins patenting, there is a high likelihood that they will pass the U.S. in the number of crop breeding patent applications produced. Based on the recent filing data, it’s clear that China has taken a a more aggressive interest in crop breeding and is using these innovations to position themselves not only to meet the needs of their own domestic population, but to potentially challenge the U.S. as the “Breadbasket of the World.” This is a terrific bit of research and there’s a lot more interesting data worth digesting. You can see form the information that the Thompson Reuters team has put a lot of time and research into this study and have certainly delivered a quality report. (Source: Thomson Reuters, 9 Billion Bowls)