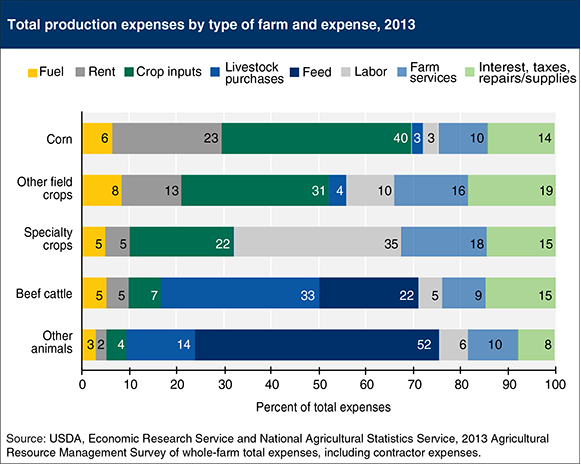
Lately, the USDA and its subsequent agencies have been putting out some nice data on the cost-of-production-side of farming. The most recent chart shows the variation in the percent of total expenses across different types of farms. I know that’s a mouthful, but the chart reflects how specialized US agriculture has become. While wide differences generally exist between crop and livestock farms, this new breakdown compares expenses within the major farm types. Livestock purchases are the largest component of total expenses for beef cattle farms, primarily because of the relatively high cost of feeder steers. In comparison, because of the lower cost of their animal purchases, feed expenses are the largest component of total expenses for other animal farms (primarily hog, poultry, and dairy). Specialty crop farms have a higher share of labor expenses than field crop farms, because they occupy fewer acres and are less mechanized. Other findings are fairly straightforward. For example, specialty crop farms have a higher share of labor expenses than field crop farms, because they occupy fewer acres and are less mechanized. In contrast, field crop farms, especially corn farms, spend a greater share directly on the crop including fertilizer, seeds and chemicals and rents. Interestingly, fuel expenses are relatively consistent, varying between 3% of total expenses for other animal farms to 8% for other field crop farms. This information comes the Agricultural Resource Management Survey (ARMS) which collects data at the field-level on production practices and costs (fertilizer, pesticide, labor, tillage, seed, etc.) for target commodities. The survey collects information from 48 States and is designed to be representative of the continental US and to support State-level estimates for 15 key agricultural States.